Data Visualisation
Contributed by: Harry Lloyd, ORCID iD
Original published date: 13/06/2024
Last modified: See Github page historySuggested Citation: Harry Lloyd, “Data Visualisation,” Digital Scholarship & Data Science Essentials for Library Professionals (2024), [DOI link tbd]
Introduction
Why do we visualise data? For data to tell us something we need to look for patterns, and we are much better at finding these patterns in colours and shapes than in a table of raw data. Visualisations are key to developing the story we want to tell with our data.
When do we visualise data? There are two main moments when working with data that we need to visualise it. First, in the exploratory phase, when we are trying to understand the data, to get insights that lead to fruitful lines of enquiry. These visualisations are rough and ready, meant for us or at most a select few around us to generate debate about what information the data might contain.
Second, in the explanatory phase, when we have understood the data and move on to insightful analyses that generate new understanding. These visualisations communicate what we have learned from the data to others. They need to be clear, because we are trying to explain conclusions we have made from intimate knowledge of the data to people who have not worked with it, and are trusting us to explain faithfully what we have learned.
In libraries this covers visualisations for users of our services designed to improve content discovery and so they can understand our data, as well as research carried out by librarians and digital humanists that generates new knowledge. Particularly for our users, whose needs should be at the heart of the services we supply, visual routes we supply into our data need to be as clear as anything we’re presenting as research.
How do we visualise data? There are a huge variety of tools available. Practitioners may lovingly hand draw images (physically or digitally), from early 19th century visualisations by Florence Nightingale and W. E. B. Du Bois to the work, verging on art, of Federica Fragapane. More commonly there are deeply customisable packages in modern programming languages like R, Python or Javascript, or commercial plotting software like Tableau. Excel has endured through its simple learning curve, ubiquity and reliable outputs. A whole separate suite of software exists for geospatial and linked data. Ultimately the right choice is decided by our use case, data, resources and skills.
Relevance to the Library Sector (Case Studies/Use Cases)
Exploratory data visualisations are both quite generic and very dataset specific. Simple plots like bar charts, histograms, scatter plots, and time series are simple enough to be reliable and fit the ethos of being quick and informative of the features of your data. This Power BI dashboard from Brandi Jagars at University of South Florida Libraries shows how simple visualisations give quick insights into a visitor dataset.

Visualisations designed for users and for publication are much more varied, and (usually) more polished. Maps are an eye-catching and engaging interface into collections that tap into users’ sense of place. The Mapping Manuscript Migrations project offers a map view of global manuscript migrations allowing users to track the movement of manuscripts filtered by things like collection, author and date of publication.

Peripleo is a browser based map viewer that can be used with any cultural heritage dataset with associated location information. It was used in the Heritage for All project to displaying items in hyper-local contexts.

Both of these initiatives rely on the concept of Linked Open Data. Each element of linked data is linked to other elements by one of a defined set of relationships, rather than the traditional spreadsheet model where each row is an item with a certain set of properties. This transforms the data into a network, which allows for intuitive, interactive visualisations that let users navigate material contextualised by the items closely linked to it.
The Semantic Name Authority Cymru (SNARC) provides views into a linked database of name authority records linked to Wales and the Welsh language. This makes graphs like this family tree of Charlotte Guest, a translator, businesswoman and noble, easy to produce. Displaying parts of the network let users understand the connections within it, as in this rather large, but very satisfying, graph of Welsh estates, houses and their owners.

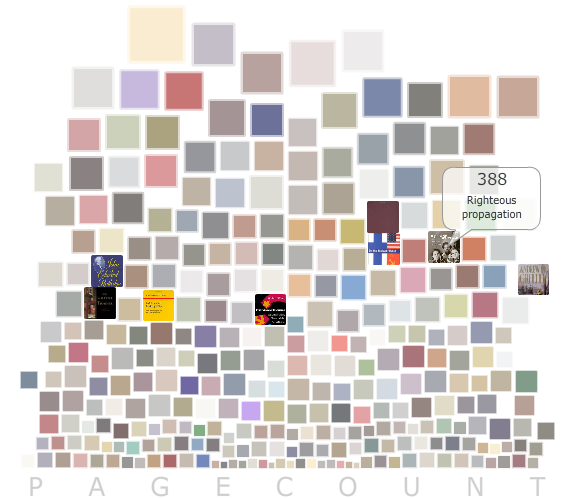
There’s also huge value in making visualisations like this available in physical form within the spaces of a library. The Bohemian Bookshelf was a 2011 project to increase serendipitous book discovery that was installed in the University of Calgary Library. It used 5 different visualisations to ‘entice curiosity’ by taking users to books and authors they might not have otherwise explored. This echoes Dr Mia Ridge’s proposed metric of ‘clicks to curiosity inspired’ in seeking ways to make it easy for users to be inspired by the collection. The ‘book pile’ arranged books by size and page count, acknowledging our natural fascination with the very large and the very small.
You can explore other use cases in this helpful list from the University of Minnesota Libraries. They’ve catalogued library specific resources for a range of use cases like the teaching, evaluation, and history of data visualisation in libraries.
Hands-on activity and other self-guided tutorial(s)
The best way to understand the value of data visualisations is to produce them for your datasets. Here are a few tools you can plug datasets into, organised by type and the skills needed to use them.
Immediate results
RAWGraphs is an online platform (no sign up required) you can upload a spreadsheet to (save it as a CSV first) or a JSON file and point and click your way down the page to produce a visualisation. It’s perfect for exploratory analysis and learning about the different kinds of visualisations available.
Voyant Tools provides a similarly easy entry for corpus scale text data (whole works, or collections of works), though it helps if you know a little about corpus linguistics. There are ‘pre-built’ corpora of Shakespeare, Austen and Frankenstein available if you don’t have your own files to upload.
Spreadsheet based
Excel remains such an easy way to interact with spreadsheet data. If you haven’t used it before there are lots of resources available online or your institution may have Microsoft Office skills courses. This gentle intro from University of Minnesota libraries assumes some knowledge but not too much. PowerBI is a more advanced Microsoft Office app that allows you to create dashboards from data. It interfaces easily with Office software but the visualisations aren’t hugely inspiring. Justin Kelly has an introduction for librarians. Google Charts and Sheets and OpenOffice Calc and Impress are equivalent alternatives.
Tableau is one of many commercial softwares for visualisation. There’s a learning curve similar to Excel, and a free (sign-up required) public platform you can try in browser, use the learning resources to get started.
Intro to coding
The R for Data Science Data Visualisation tutorial covers using ggplot2, the de facto standard for plotting in R. You can code along with an R environment in browser using Posit Cloud (requires a free account).
Seaborn is one of the main plotting packages in Python and follows a similar philosophy to ggplot2. You can code along to their tutorial with a Python environment in browser using Google Colab (requires a Google account).
Mapping and Linked Data
Geospatial and linked data (where elements of the data can be explicitly linked to other elements) have their own worlds of tools, with functionality also often covered by the types of tools already listed. ArcGIS (now common in its online form) and QGIS are the most common paid and open source Geographic Information Software (GIS) tools available. You can use these to work with data with geographic components and make display worthy maps. Their outputs also plug into Python, R and JavaScript libraries like leaflet or Dash. Programming Historian have a series of mapping lessons, from an intro to QGIS to converting historical place names into locations on a map.
For linked data tools like Gephi or Nodegoat have graphical user interfaces, or there are programming packages like igraph, NetworkX, and D3.js.
Recommended Reading/Viewing
Much data visualisation is communication, and so is deeply subjective. Good visualisations are guided by design philosophies built upon how we process visual information. Two influential books that develop these philosophies are The Grammar of Graphics by Leland Wilkinson and The Visual Display of Quantitative Information (2nd Ed.) by Edward R. Tufte. The Grammar of Graphics is a hefty tome that proposes a core set of components for graphics then builds them from the ground up, with reference to programming. Visual Display is perhaps a little more accessible and uses the idea of how ink is used (digitally or physically) to understand what is and is not important in a graphic.
If visualisation is communication and how we understand visual communication is subjective, then catering generously to how different people process visual information is important. We might call this accessibility. This talk explains some of the basics of how our brains handle colour, and the importance of colour in visualisation. The Seaborn explanation of colour palettes is a helpful reference, and there is a free colour blindness tester to check that your visualisations encode information in colours that everyone can distinguish. Use alt-text for screen reader access and review for keyboard and content accessibility. Harvard have a helpful guide.

With these considerations in mind there are graphics catalogues that help guide you towards the best visualisation for your purposes. from Data to Viz starts with types of data and leads you to appropriate graphs, while the Financial Times Visual Vocabulary starts with relationships between elements of your data and guides from there. Both are valuable.
Taking the next step
Data visualisation, like any other skill, takes practice and familiarity with tools to get the best results. It is, however, relatively easy to make simple but effective visualisations that help you understand your data or explain it to someone else. So take some of your data and begin to play around with it. Play is an important word, you are being creative! Make mistakes and do the unexpected as you learn and you will be better for it. It is, unfortunately, just as easy to make bad visualisations that confuse you and your audience. Start simply, more complex visualisations will come with time.
If you haven’t done any visualisation before start with something like RAWGraphs or Excel for tabular data, or Voyant Tools for text data. If you have geographic data find a GIS specialist, or use the tutorials for QGIS or ArcGIS. If you have some experience with visualisations then tailor your choice of tool to your data. And if you’re familiar with programming then look at the plotting packages available, and enjoy the flexibility and reproducibility they give you.
Engage with designers if they’re available to you and you are producing work for users or the wider public. The art of designing things for people applies as much to data visualisation as it does to anything else.
Above all remember your audience. Keep clear in your mind what it is you are trying to communicate, and to who, and ask yourself if your visualisation does that. Continue to iterate until it does, and you will have explained the story in your data clearly.